


作者简介
杰米·肯尼迪2006年在俄亥俄州立大学获得硕士学位,现在是肯特州立大学摄影系副教授。 他与凯利·厄克特合作的作品在20多个国家级和世界级展览上展出。 其中包括:由苏珊·基斯马里克主评审,在新泽西州视觉艺术中心展出的“第24届国际评审展”,纽约现代艺术博物馆“摄影的管理者”,德州理工大学艺术学院摄影系主办,在德州理工大学SRO展览馆展出的“悬挂,绘画及四等分”,由梅尔·秦主评的在德州大学奥斯汀分校科尔艺术中心展出的“德克萨斯国家展2009”。 2007年杰米获得俄亥俄州艺术委员会颁发的个人创造奖。
创作自叙
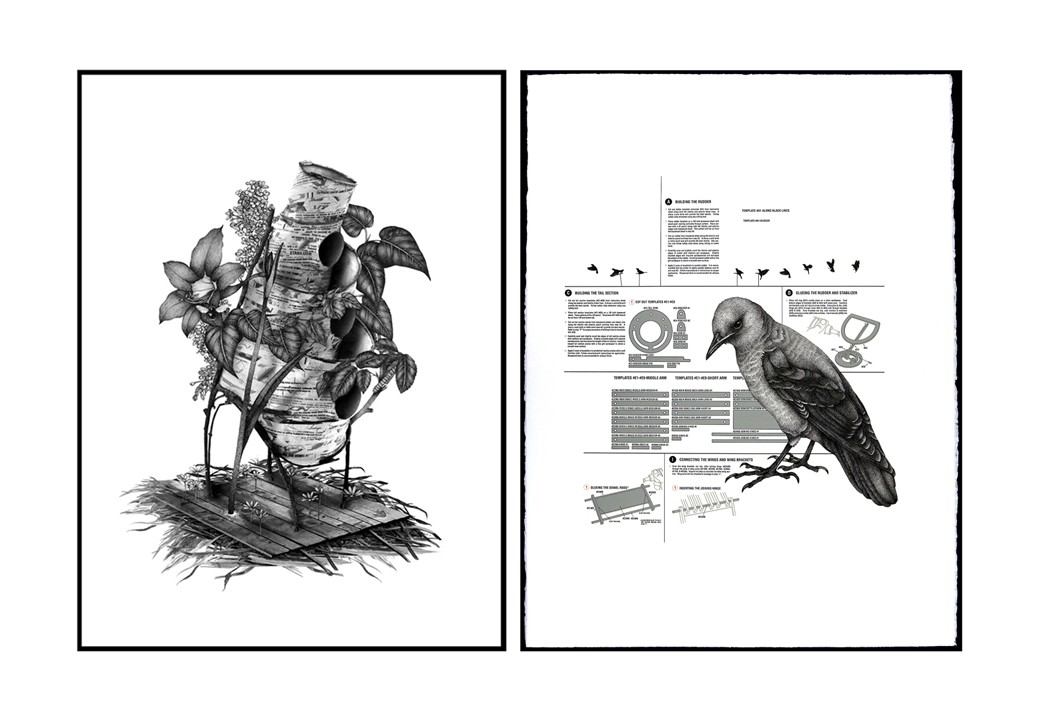
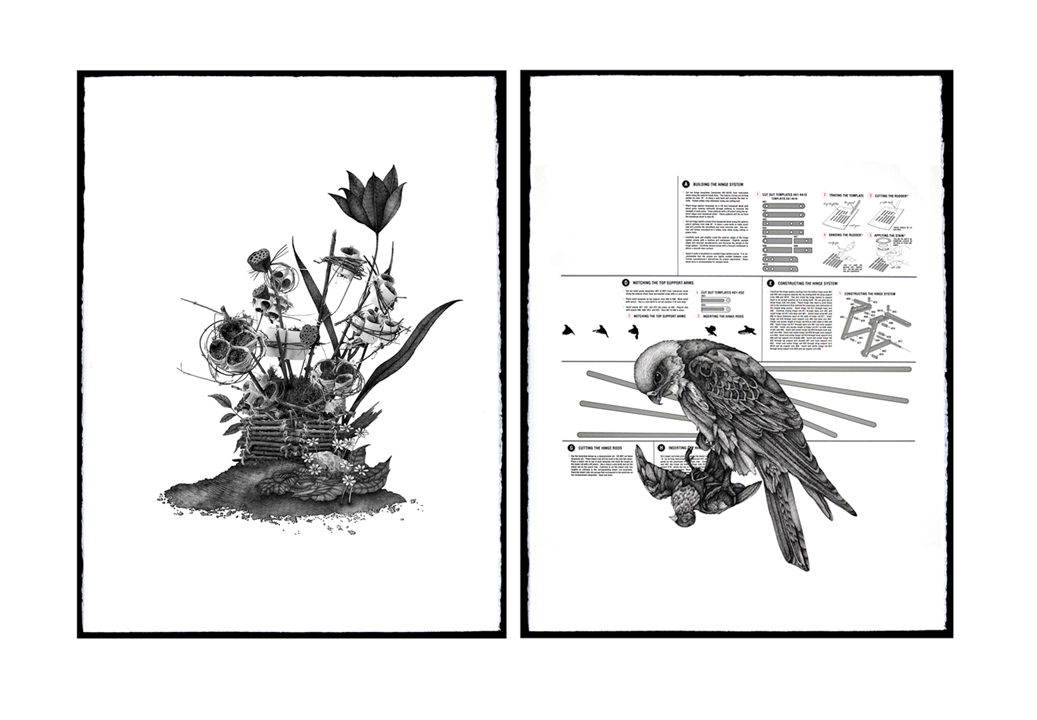
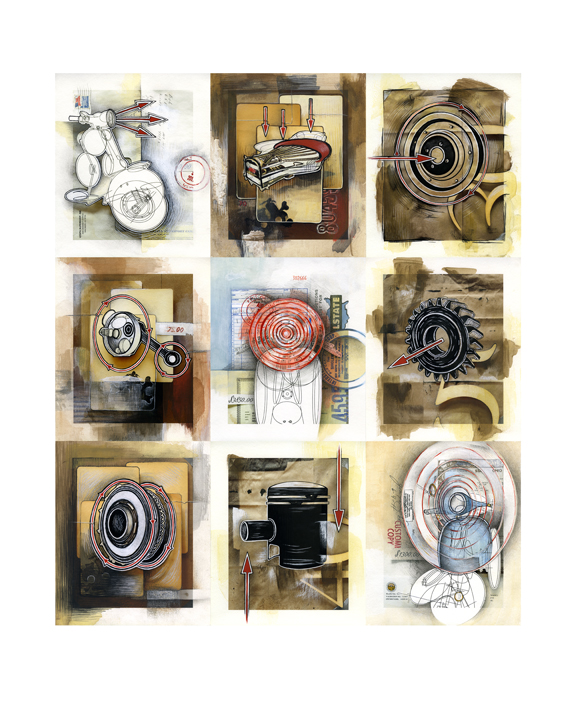
这一系列多媒体构筑的图画,利用拉尔夫·尼尔森·埃利奥特的埃利奥特波浪理论,形象地勾勒出纽约证券交易所的运作。 这一系列创作的目的是测试在不稳定全球经济环境下,这一经济理论的盈利性。 该系列的设计并不遵循美学角度,而是制造出视觉公式记录数据,用以代表埃利奥特的波浪方法论。
拉尔夫·尼尔森·埃利奥特提出,是拥挤心理而并非经济基础决定证券市场的走向。 埃利奥特表示从股市的微波动到世纪大周期上可以看到拥挤心理的程度。 他提出,通过斐波那契数列,这些乐观或悲观的心理波浪可以被计算和预测出来。
在18个月内,我们在不同时间内基于股票的波浪位置购买和出售了21种股票。 记录每个股票的价格波动情况,将之平均并输入到手工制作的模型中。 我们从俄亥俄州亚克朗市反转世纪砖头街拿的大粘土砖重塑我们的图画。 网状结构的雕塑有105块砖头,象征交易的典型时间。 如果价格上升,就会添加一块砖;如果价格下跌,就不添加。 这个砖块雕塑之后被摄影和数字化。 之后老旧的砖头被基于色子自由滚动制成的手工绘画砖头取代,这样做是想反映股票市场的行为特征。 总之,在21支股票中,平均80%得获得收益。
Bio
Since 2008, Kelly Urquhart and Jaime Kennedy have exhibited their collaborative artwork in over 20 national and international exhibitions. Selected exhibitions include: the 24th International Juried Exhibition at the Visual Arts Center of New Jersey juried by Susan Kismaric, Curator of Photography, Museum of Modern Art, New York, NY, Hung, Drawn, and Quartered, SRO Photo Gallery, Texas Tech University’s School of Art, juried by Texas Tech University’s School of Art Photography Faculty, and Texas National 2009 at the Cole Art Center, Stephen F. Austin State University juried by Mel Chin.
In 2007, Jaime received an Ohio Arts Council Grant for Individual Creativity and is currently an Associate Professor of Photography at Kent State University. Kelly received her MFA from Miami University in 2007 and Jaime graduated with his MFA from Ohio State University in 2006. They both live and work in Kent, Ohio.
Artist Statement
This sequence of multimedia, constructed photographs visually maps our participation in the New York Stock Exchange utilizing Ralph Nelson Elliott’s Elliott Wave Theory. The purpose of this series was to test the profitability of an economic theory while engaging in an unstable global climate, produce images free from the aesthetic decision making process, and provide a visual formula of recorded data that represents Elliott Wave methodology.
Ralph Nelson Elliott proposed that crowd psychology, not economic fundamentals, was the key factor that moved the stock market. Elliott showed that the degree of crowd psychology was observable on a subminuette level up to a multi-century Grand Supercycle. He proposed that these “waves” of optimism or pessimism could be measured and predicted through the Fibonacci number sequence.
Over a period of 18 months, we bought and sold 21 stocks at varying times based upon their wave position. Each stock’s price movement was recorded, averaged, and fit into a hand-constructed sculpture. The large, clay bricks were reclaimed from turn-of-the-century brick roads in Akron, OH and then repurposed for our constructed photographs. The grid-like sculptures held one hundred and five bricks symbolizing time in a typical trading period. If the price went up it got a brick, if the price went down, no brick. The brick sculptures were then photographed and digitally composited. Antiquated bricks were then replaced with hand-painted bricks based on random dice rolls to visually represent the game-like behavior of the stock market. Overall, we averaged an 80% gain between the 21 stocks.